

Stop drawing formations.
Start reading them.
Our indicators find XABCD formations for you and project the D Zone, stop and invalidation levels. You see the formation while it forms, not after you have measured it by hand.
Works on any market and timeframe on TradingView · Crypto, FX, indices, stocks
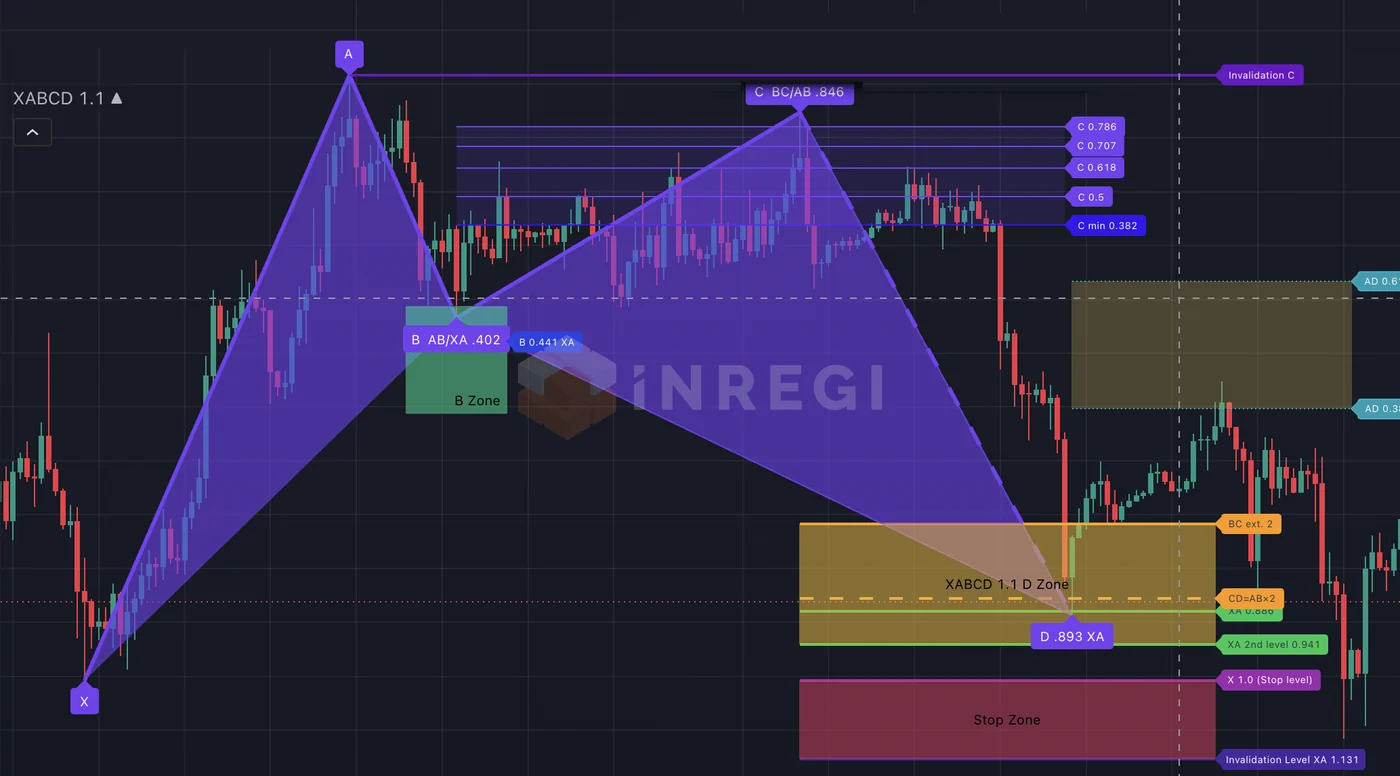
Selected example, not a performance result.
Hours of measuring, done on every candle close
Finding a valid XABCD formation means checking several Fibonacci ratios across five swing points. The indicator does it automatically and tells you exactly where the formation stands.
Automatic detection
X–A–B–C is detected on closed candles and checked against the formation's ratio rules. No manual drawing.
Live preview
Shows live the potential B and C zones and the D Zone while the formation is still forming — before it is confirmed.
Levels ready to use
D Zone, stop level, stop zone, invalidation and AD targets — plus a panel with entry, SL, risk % and R:R.
Every formation has a clear status. An alert fires the moment price touches the D Zone — so you can stop watching charts and come back when something happens.
Formations are sold in sets
The name tells you the structure: Z is the zone of point B as a share of XA (Z1 38.2–<50% · Z2 50–<61.8% · Z3 61.8–<78.6% · Z4 78.6–100%) and D- is the level of point D. Every formation includes Bullish ▲ and Bearish ▼. Pricing is announced at launch.
Set 1: Regular D
78.6–88.6% XA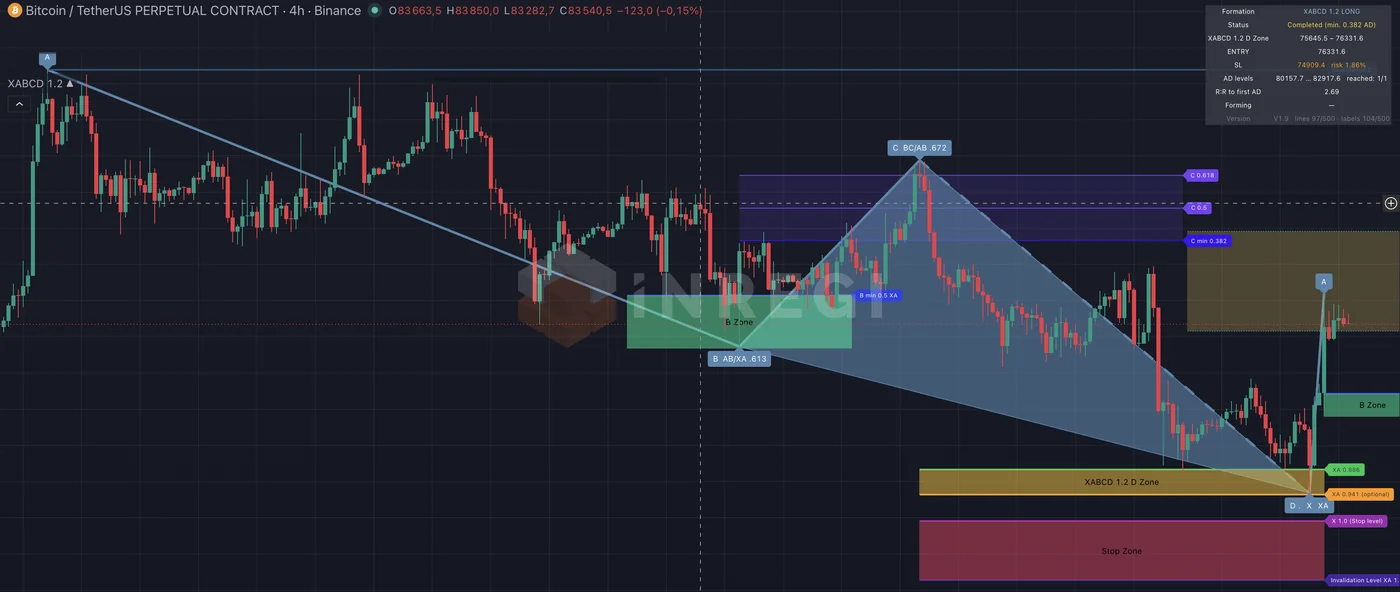
Set 2: Extended D
113–141.4% XA
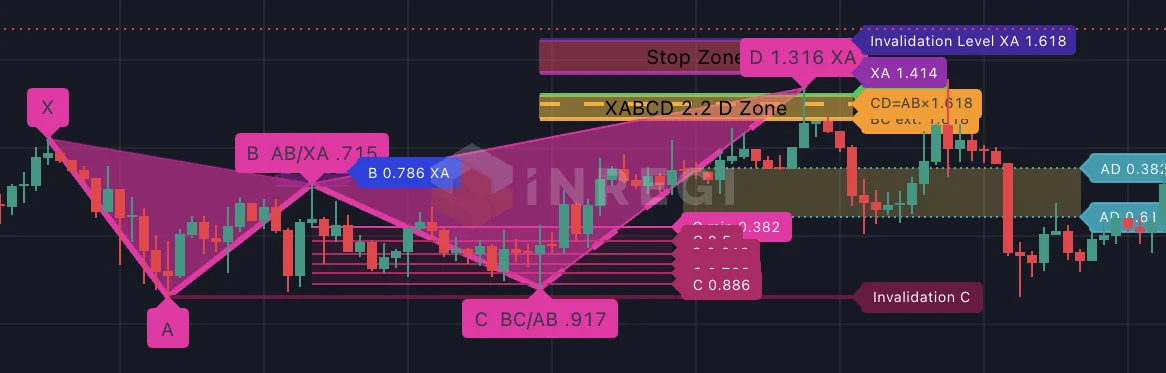
Set 3: Extended D
161.8% XASet 4: Irregular C
C beyond A, D from XCSet 5: AB Measurement
D from AB
Charts are selected examples, not performance results. Pictures of 2.1 and 5.2 are schematics of the structure, not charts.
What we promise — and what we don't
No win-rate claims
XABCD formations are a geometric tool. We tested them as a mechanical strategy — they show no statistical edge after costs on their own. We sell time saved, not profits.
Repainting explained
Logic runs on closed candles only. Every case where the drawing can change is documented on each indicator's page.
Built by traders & engineers
InRegi builds tools with working traders and validates them with the same statistics we use for our own research.